
In academic and scientific publishing, well-designed graphs, figures, charts, diagrams, and maps are essential for communicating research findings clearly and efficiently. Complex datasets can often be difficult to interpret when presented only as text or tables. Appropriate visualizations can reveal patterns, trends, relationships, spatial distributions, and differences that may not be immediately apparent from numerical data alone. Genesis Research Consultancy Limited (GRCL) provides specialized Graph and Map Preparation Services for Manuscripts, helping researchers transform their datasets and research findings into accurate, informative, professional, and publication-ready visual materials. Our services are suitable for research articles, review papers, theses, dissertations, conference papers, research reports, project reports, and academic presentations.
We work with researchers across a broad range of disciplines, including biological sciences, agriculture, fisheries, marine science, veterinary science, medical science, dentistry, public health, environmental science, pharmaceutical science, social sciences, economics, business, and computer science. Our objective is not simply to make figures visually attractive. We focus on ensuring that every graph or map accurately represents the underlying data, communicates the intended message, follows appropriate visualization principles, and complies with the requirements of the target journal or publisher.
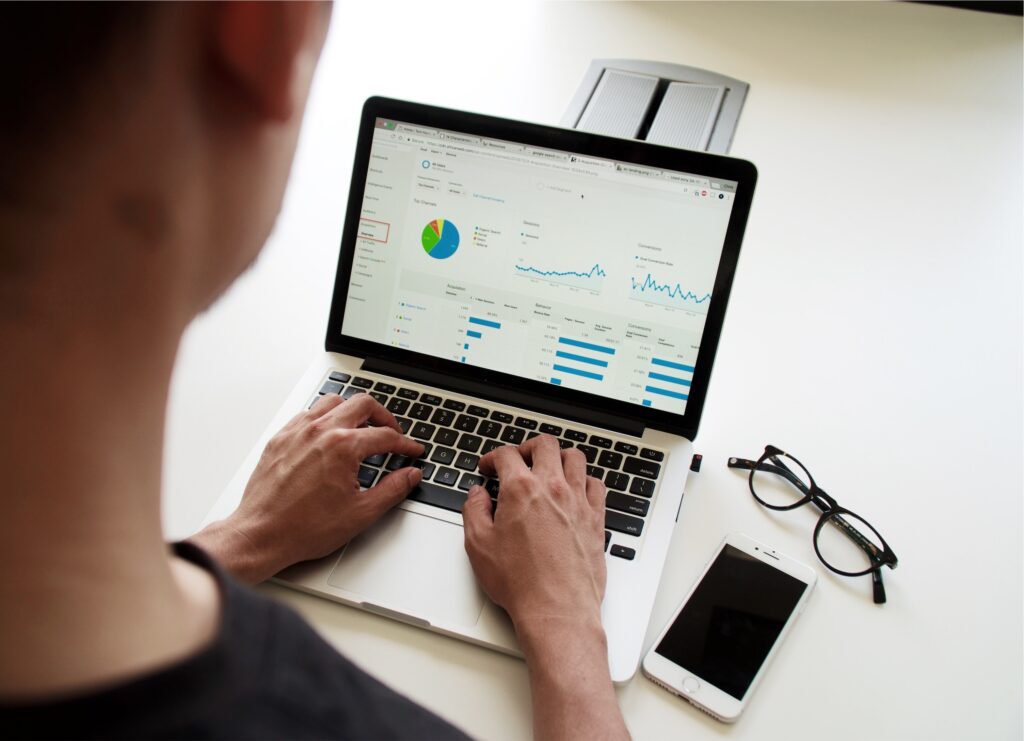
Our Graph and Map Preparation Services Include
1. Scientific Graph Creation
We create a wide range of scientific graphs according to the characteristics of your data and research objectives. Rather than applying the same graph type to every dataset, we help select an appropriate visualization that communicates the information effectively. Our graph preparation services may include:
- Bar charts
- Grouped and stacked bar charts
- Line graphs
- Scatter plots
- Box-and-whisker plots
- Violin plots
- Histograms
- Density plots
- Dot plots
- Area charts
- Error-bar plots
- Regression plots
- Correlation plots
- Heatmaps
- Forest plots
- ROC curves
- Survival curves
- Interaction plots
- Time-series visualizations
- Multi-panel figures
- Other discipline-specific scientific figures
Where appropriate, we incorporate means, standard deviations, standard errors, confidence intervals, significance indicators, regression lines, trend lines, and other relevant statistical information.
2. Publication-Ready Figures
Journal publishers often impose specific requirements regarding figure dimensions, resolution, file formats, fonts, labels, line widths, and color modes. We prepare figures with publication requirements in mind. Depending on the target journal, we can assist with:
- Figure dimensions
- Resolution optimization
- Font consistency
- Axis formatting
- Legend placement
- Label positioning
- Line and marker formatting
- Panel arrangement
- Appropriate file formats
- Figure numbering
- Caption preparation
- Journal-specific formatting
Our objective is to produce figures that can be incorporated into a manuscript with minimal additional modification.
3. Geographic and GIS Map Preparation
For research involving geographic or spatial information, an appropriately designed map can significantly improve the presentation of research findings. Using professional GIS workflows and software such as QGIS and ArcGIS, we prepare maps for a variety of research applications, including:
- Study-area maps
- Sampling-location maps
- Distribution maps
- Biodiversity maps
- Habitat maps
- Land-use and land-cover maps
- Environmental maps
- Ecological maps
- Agricultural maps
- Fisheries and marine-resource maps
- Disease distribution maps
- Demographic maps
- Socio-economic maps
- Spatial variability maps
- Thematic maps
- Administrative maps
- Watershed and hydrological maps
- Coastal and marine maps
- Conservation and protected-area maps
4. Study Area and Sampling Location Maps
Study-area maps are particularly important in field-based research. We can prepare maps that clearly identify:
- Country and regional location
- Study site
- Sampling stations
- Survey locations
- Rivers, lakes, coastlines, and other geographic features
- Administrative boundaries
- Major roads and settlements
- Relevant geographic landmarks
Maps can be designed at multiple spatial scales to provide both regional context and detailed study-site information.
5. Thematic Mapping
Thematic maps allow researchers to communicate the spatial distribution of specific variables or phenomena. We can prepare thematic maps representing variables such as:
- Species abundance
- Species richness
- Environmental parameters
- Pollution levels
- Disease prevalence
- Agricultural productivity
- Land-use categories
- Population characteristics
- Socio-economic indicators
- Climate variables
- Soil characteristics
- Water-quality parameters
- Habitat characteristics
Appropriate classification, legends, symbols, and spatial scales are selected according to the nature of the data.
6. Spatial Data Visualization
For research involving spatial datasets, we can help transform geographic information into meaningful visual representations. This may include point, line, polygon, raster, and other spatial data formats. Where appropriate, we can assist with:
- Spatial distribution
- Spatial interpolation
- Density visualization
- Buffer analysis outputs
- Spatial overlays
- Raster visualization
- Classification
- Spatial comparison
- Thematic representation
The analytical method used should be consistent with the research objectives and characteristics of the spatial dataset.
7. Advanced Scientific Data Visualization
Some datasets require more sophisticated visualizations than conventional charts. We can prepare advanced figures for complex datasets, including:
- Multivariate plots
- Principal component analysis plots
- Cluster visualizations
- Correlation matrices
- Heatmaps
- Ordination plots
- Multi-dimensional data displays
- Network-style visualizations
- Model-output visualizations
- Comparative analytical figures
These visualizations can be particularly useful in multidisciplinary and data-intensive research.
8. Multi-Panel and Composite Figures
Many journals encourage researchers to combine related results into a single coherent figure. We prepare professional multi-panel figures containing multiple graphs, images, maps, or diagrams. For example: Figure 1A–D may combine several related experimental results into one figure while maintaining consistent:
- Font
- Scale
- Axis formatting
- Labels
- Symbols
- Figure dimensions
- Spacing
- Panel numbering
This creates a visually consistent presentation while reducing unnecessary repetition within the manuscript.
9. Statistical Figure Preparation
Where statistical analysis has already been performed, we can convert statistical outputs into appropriate graphical representations. Examples include:
- Treatment comparisons
- Group differences
- Regression relationships
- Correlation patterns
- Time-dependent changes
- Confidence intervals
- Effect estimates
- Statistical significance
- Model predictions
We emphasize accurate representation of statistical results and avoid graphical designs that could potentially exaggerate or misrepresent findings.
10. Data Visualization and Scientific Communication
Effective visualization involves more than choosing colors and adding graphical elements. The figure should communicate a specific scientific message. Our team helps researchers consider:
- What information should be emphasized?
- Which graph type best represents the data?
- What comparisons should readers make?
- Which variables should be displayed?
- How should scales be selected?
- How should uncertainty be presented?
- How can unnecessary visual complexity be reduced?
The result is a visualization that is both scientifically informative and accessible to the intended readership.
11. Image Enhancement and Editing
Existing figures and images may require improvement before submission. We provide image-editing support to improve the technical quality and presentation of research visuals. Depending on the nature of the material, this may include:
- Resolution enhancement
- Cropping
- Alignment
- Background cleanup
- Contrast adjustment
- Brightness adjustment
- Label enhancement
- Removal of unnecessary elements
- Image resizing
- Format conversion
- Panel arrangement
- Annotation and labeling
All modifications should preserve the scientific meaning and integrity of the original material.
12. Journal-Specific Figure Formatting
Different journals may have different requirements for figures. We can adapt graphs and maps according to the guidelines of the target journal. This may include requirements relating to:
- Figure size
- Resolution
- File type
- Font
- Color
- Line thickness
- Image dimensions
- Number of panels
- Figure captions
- Supplementary figures
Researchers can provide the relevant journal guidelines, and we will use them as the basis for formatting.
13. Color, Grayscale, and Accessibility Considerations
Not every visualization should depend heavily on color. We consider whether a figure remains understandable when printed in grayscale or viewed by readers with color-vision deficiencies. Where appropriate, we use:
- Distinct symbols
- Line styles
- Patterns
- Appropriate contrast
- Clearly differentiated categories
- Readable labels
This can improve the accessibility and robustness of scientific figures.
14. Map Elements and Cartographic Design
A scientifically useful map should contain appropriate cartographic elements. Depending on the purpose of the map, we can incorporate:
- Scale bar
- North arrow
- Legend
- Coordinate information
- Inset map
- Grid or graticule
- Location labels
- Administrative boundaries
- Sampling points
- Basemap information
- Projection information where appropriate
- Data-source information
We aim to balance geographic detail with readability so that the map remains useful at the intended publication scale.
15. Figure Caption and Legend Support
A figure should be understandable without requiring readers to search extensively through the main text. We can assist with figure captions and legends that clearly explain:
- Variables
- Symbols
- Abbreviations
- Treatment groups
- Statistical indicators
- Sampling locations
- Map features
- Relevant methodological information
Captions can also be adapted to the formatting requirements of the target journal.
16. Conversion and Technical Formatting
Research figures may be generated using different software and saved in different formats. We can assist with preparing files in commonly accepted formats according to the target journal’s specifications. This may include conversion and optimization of:
- Raster images
- Vector graphics
- Graph files
- GIS map outputs
- Composite figures
- Supplementary figures
17. Figure and Map Quality Control
Accuracy is one of the most important aspects of scientific visualization. Before final delivery, we review graphical materials for potential technical and presentation problems. Our quality-control process may include checking:
- Data labels
- Axis values
- Units
- Legends
- Symbols
- Statistical annotations
- Scale bars
- Sampling locations
- Geographic labels
- Figure numbering
- Consistency between text and figures
- Consistency between tables and figures
- Resolution and formatting
We aim to reduce avoidable errors before manuscript submission.
Why Choose GRCL for Graph and Map Preparation?
Research-Focused Expertise
Our services are designed specifically for academic and scientific research rather than general-purpose graphic design.
Multidisciplinary Experience
We support visual preparation for research across biological, environmental, agricultural, medical, veterinary, fisheries, marine, social-science, economic, business, and computer-science disciplines.
Professional Software
Depending on the requirements of the project, our workflows may involve tools such as OriginPro, R, QGIS, ArcGIS, and other appropriate data-visualization and scientific software.
Scientific Accuracy
We prioritize accurate representation of research data and avoid design choices that could distort the interpretation of scientific findings.
Journal-Oriented Formatting
Figures and maps can be prepared according to the requirements of the intended journal whenever those specifications are provided.
Customized Design
Every research project has different data, objectives, and publication requirements. We therefore customize each figure rather than relying on generic templates.
Consistent Visual Style
When a manuscript contains multiple figures, we maintain consistency in typography, symbols, labels, dimensions, and overall visual structure.
Efficient Turnaround
We understand that figures are often required immediately before manuscript submission or revision. We work according to agreed project timelines.
Revision Support
Where revisions are included in the agreed service, we can make reasonable modifications based on author feedback and journal requirements.
Suitable for Different Types of Research
Our Graph and Map Preparation Services may be particularly useful for:
- Original research articles
- Review articles
- Systematic reviews
- Meta-analyses
- Theses and dissertations
- Conference papers
- Research proposals
- Technical reports
- Project reports
- Government and NGO reports
- Scientific presentations
- Supplementary materials
From Raw Data to Publication-Ready Figures
A high-quality scientific figure should do more than make a manuscript look attractive. It should communicate evidence accurately, highlight meaningful patterns, support the written results, and help readers understand the research quickly. At Genesis Research Consultancy Limited (GRCL), we combine scientific understanding, data visualization principles, statistical awareness, and GIS expertise to transform research datasets into clear and professional visual materials. Whether you require a single publication-ready graph, a complete set of manuscript figures, a detailed study-area map, a series of GIS maps, or a comprehensive visual package for an entire research project, we can tailor our service to your requirements.
Contact GRCL today to discuss your Graph and Map Preparation Services for Manuscripts and receive a customized quotation.
To receive a quotation, please provide the research topic, dataset or existing figures/maps, number and type of graphs or maps required, target journal (if applicable), preferred software (if any), and relevant journal formatting requirements. Final visualization methods will depend on the characteristics and quality of the available data.